Kdo2-Lipid A / ATP gene array data - treatment:control ratiosKEGG pathway: Valine, leucine and isoleucine biosynthesis (mmu00290)| Legend: |  : View data/graphs for replicates : View data/graphs for replicates |
|---|
|
| Gene symbol |
Time course plot |
Accession |
Description |
Treatment |
15min |
30min |
1hr |
2hr |
4hr |
8hr |
20hr |
| Bcat1 | 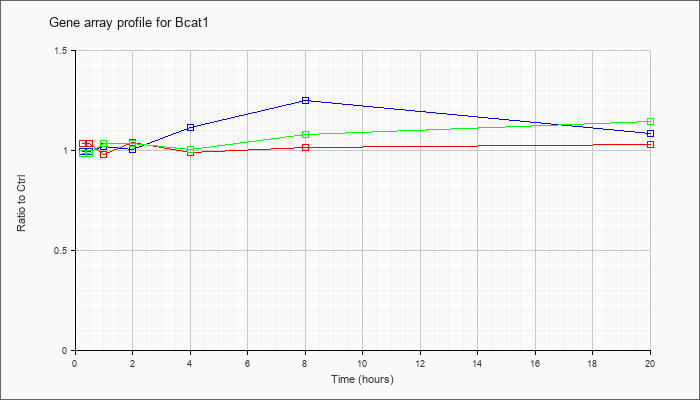 |
NM_001024468 |
branched chain aminotransferase 1, cytosolic (Bcat1), transcript variant 1, mRNA [NM_001024468] |
KLA | 1.04 |
1.03 |
.98 |
1.04 |
.99 |
1.02 |
1.03 |
| ATP | 1.00 |
1.01 |
1.02 |
1.01 |
1.12 |
1.25 |
1.09 |
| KLA/ATP | .99 |
1.00 |
1.04 |
1.04 |
1.01 |
1.08 |
1.15 |
|
| Bcat2 | 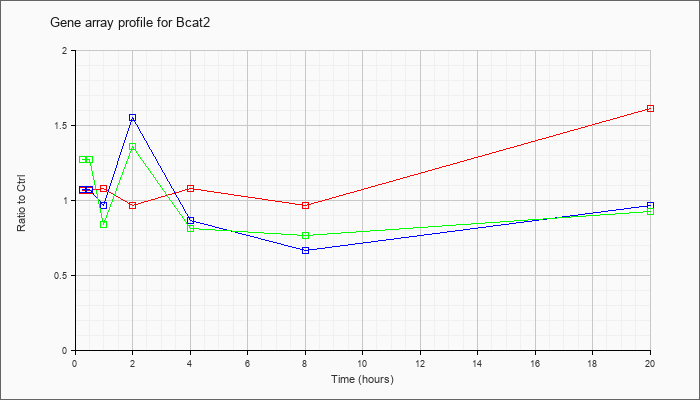 |
NM_009737 |
branched chain aminotransferase 2, mitochondrial (Bcat2), nuclear gene encoding mitochondrial protein, mRNA [NM_009737] |
KLA | 1.06 |
1.05 |
1.08 |
.97 |
1.08 |
.96 |
1.61 |
| ATP | 1.07 |
1.42 |
.96 |
1.55 |
.87 |
.66 |
.96 |
| KLA/ATP | 1.27 |
1.29 |
.84 |
1.36 |
.81 |
.76 |
.92 |
|
|