Microarray analysis of bone marrow-derived macrophage cells treated with Kdo2-lipid A (KLA) and ATP
|
Search by fold change ratio
| Search by KEGG pathway
| Search by LIPID MAPS lipid pathway
|
||||||||||||||||||||||||||||||||||||||||||||||||
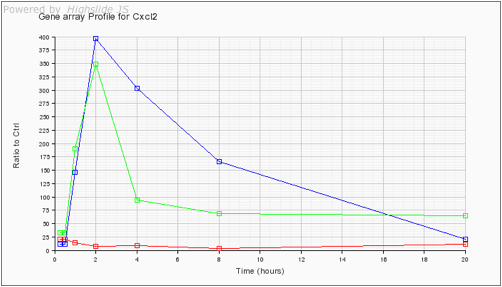
Kdo2-Lipid A / ATP gene array data - treatment:control ratiosKEGG pathway: D-Arginine and D-ornithine metabolism (mmu00472)
|
||||||||||||||||||||||||||||||||||||||||||||||||
 : View data/graphs for replicates