Lipidomics studies on macrophages

Details: PGE1

Legend:graph_icon: View detailed data for replicatesgraph_icon
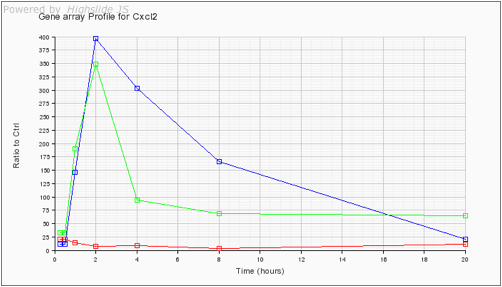
: View time course graphs
Ctrl:Untreated BMDM cells (control)
25-OHC: Cells treated with 25-OH-cholesterol at time 0
*: BMDM cells in lipid-depleted media containing compactin
25-OHC*: cells in lipid-depleted media containing compactin and treated with 25-OHC at time 0
Details Graph
Individual
Expts
Ave Biol. Reps
LM_ID Name 25-OHC*
*
25-OHC
Ctrl
0 hrs
25-OHC*
*
25-OHC
Ctrl
30 min
25-OHC*
*
25-OHC
Ctrl
1 hr
25-OHC*
*
25-OHC
Ctrl
2 hrs
25-OHC*
*
25-OHC
Ctrl
4 hrs
25-OHC*
*
25-OHC
Ctrl
8 hrs
25-OHC*
*
25-OHC
Ctrl
12 hrs
25-OHC*
*
25-OHC
Ctrl
24 hrs
Units
. . . .
Legend: :Ctrl  :25-OHC  :Comp  :25-OHC + Comp
 
Legend: :Ctrl  :25-OHC  :Comp  :25-OHC + Comp
(BCD100322)
LMFA03010134 PGE1 -
0.1
-
0.1
0.11
0.1
0.22
0.2
0.12
0.24
0.43
0.22
0.71
0.27
0.72
0.49
0.57
0.49
0.62
0.63
0.54
0.56
0.68
0.61
0.49
0.41
0.96
0.9
0.47
0.51
0.81
0.79
pmol/sample
Legend: :Ctrl  :25-OHC  :Comp  :25-OHC + Comp
 
Legend: :Ctrl  :25-OHC  :Comp  :25-OHC + Comp
(BCD100427)
LMFA03010134 PGE1 -
1.04
-
1.03
1.07
0.97
1.06
0.87
1.02
0.9
0.99
1.16
1
0.89
0.98
0.87
0.78
1.06
0.94
0.99
1
0.85
0.96
0.93
0.93
0.87
1.18
0.97
0.9
1.02
1.18
0.9
pmol/sample