How to interpret and explore results
The pathway browser consist of several components:
At the top, a bar where you can return to the LIPID MAPS site by clicking on the logo
On the left, the menu bar
At the bottom, the results tables
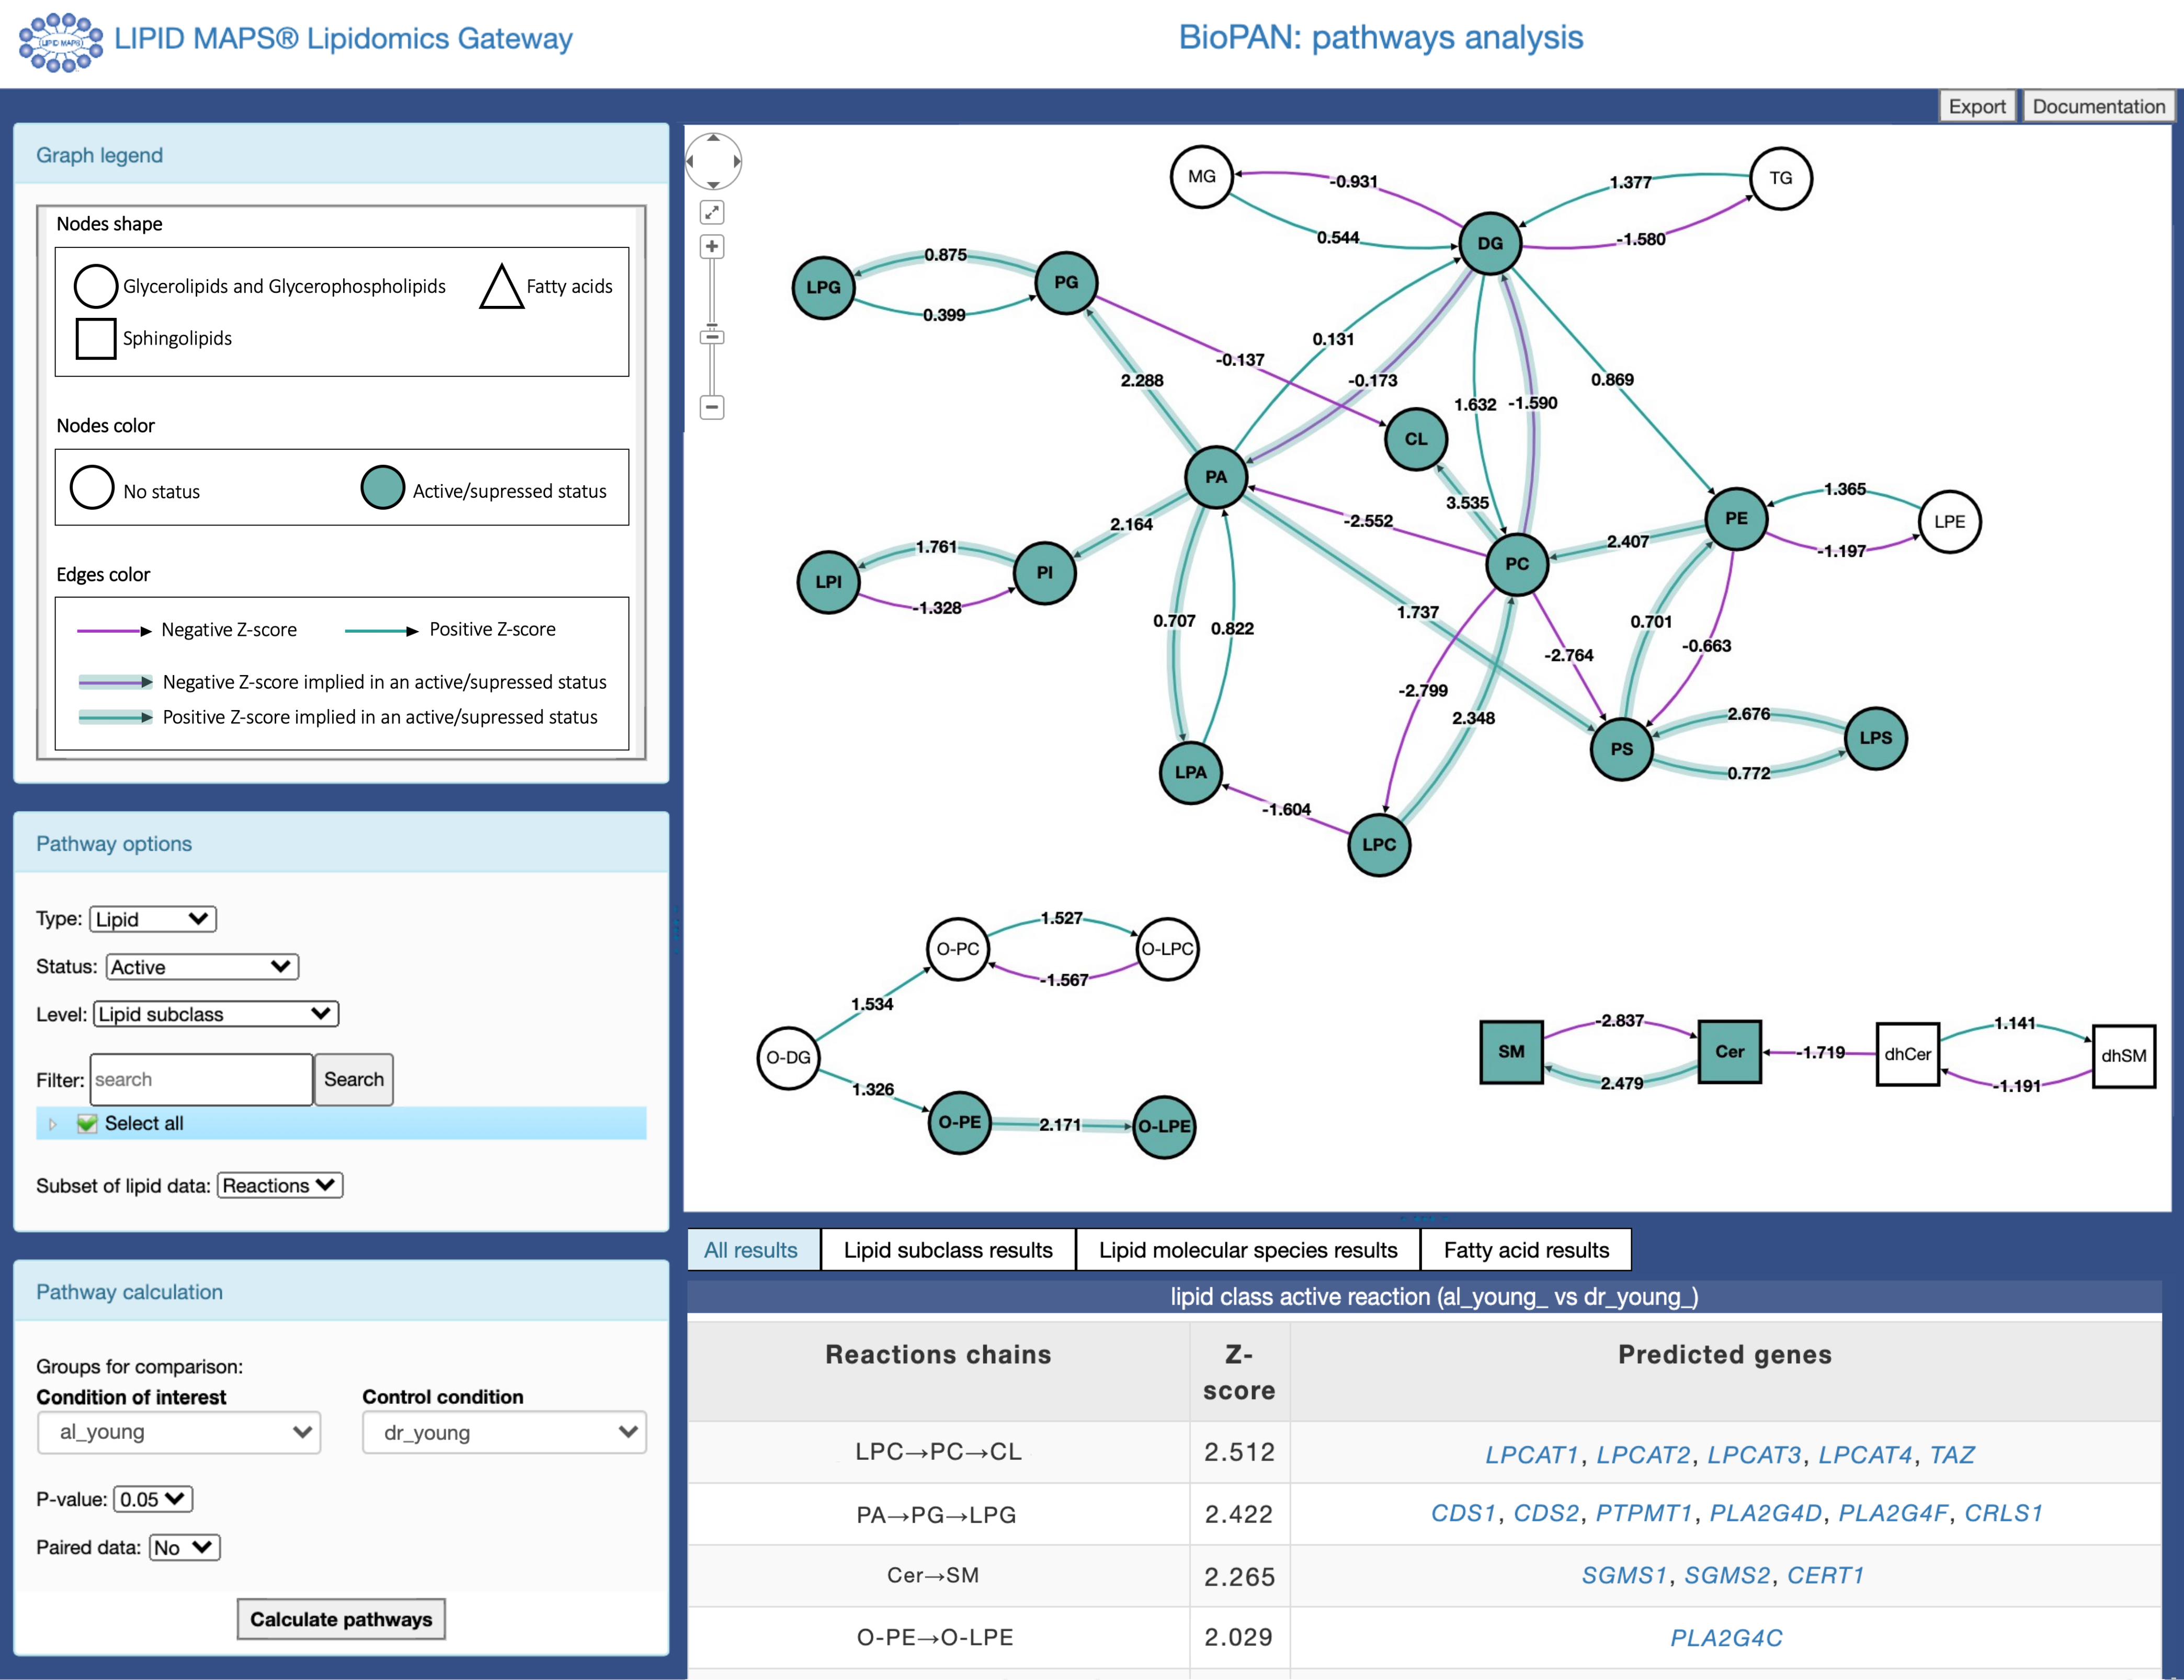
At the center, the viewport displays the pathways overview. At the top right of the viewport are buttons to export the results and to check the documentation.
Explore the graph
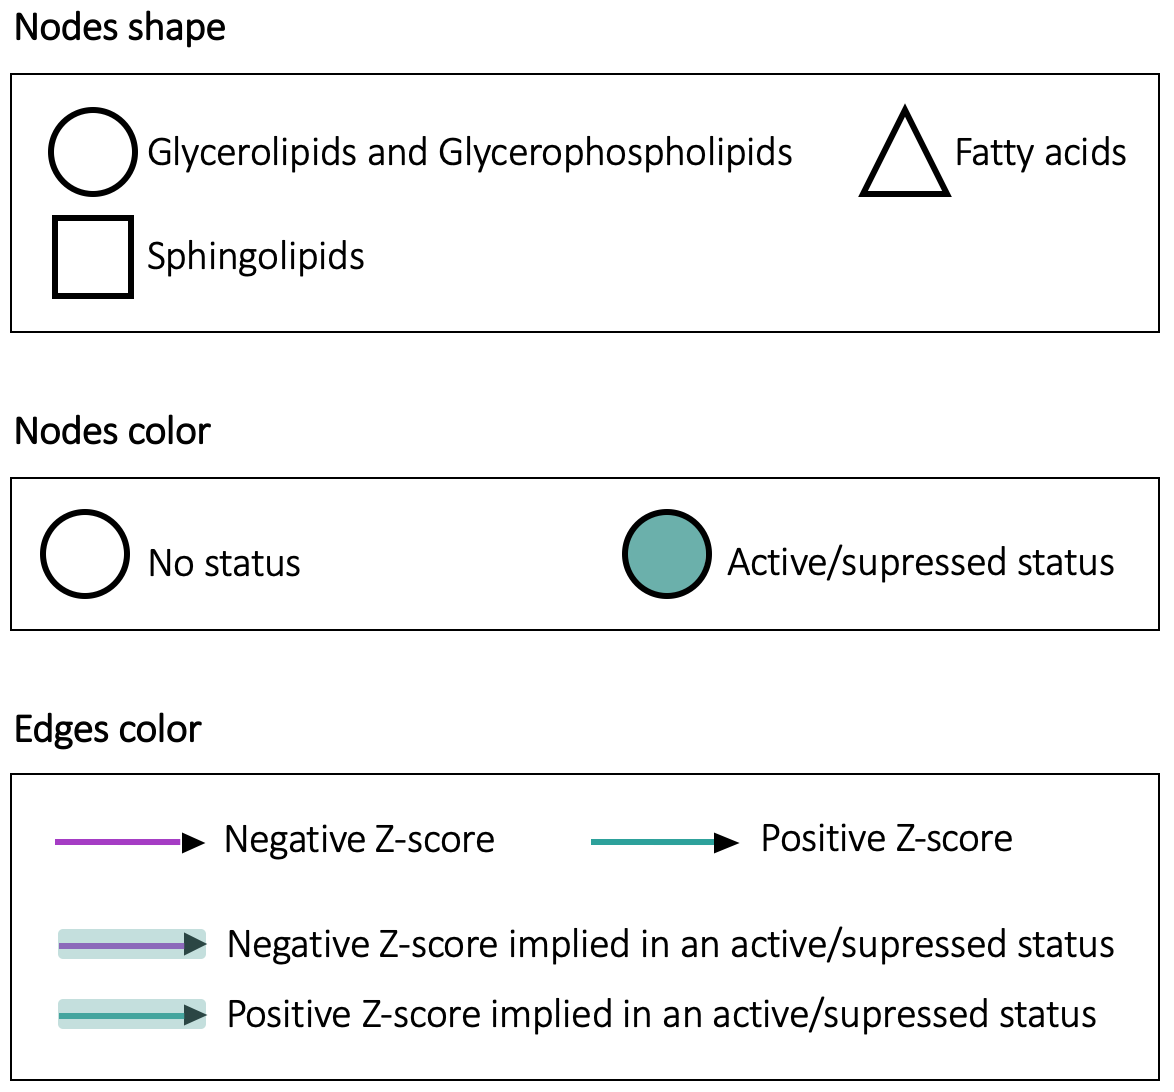
The graph represents the pathways obtained from the input file. The nodes correspond to lipids and the directed edges between two nodes symbolise a reaction between these two lipids. The nodes shape denotes the class of lipids and their colour depends on the pathway status (active/suppressed or none). The colour of the edges depends on the value of the Z-score (see point 2. of the section Pathway options): green for positive scores and red for negative scores. The reactions with a particular status are highlighted.
More information on the lipids are available by clicking on the nodes. For the lipid class graph (level option), the selected and non-selected species for a reaction are available by clicking on the associated edges.
Following is the legend for the graph. It is also available in the left menu column.
Caution
On the graph, we always display the scores for the no option of the repeated measurement menu.
You can navigate the graph, using the tools available at the top left of the white window or using the mouse. To move with the mouse, click on the graph then realise the desired movement. To zoom, use the wheel.
With the lipid class option, you can identify the species that are involved in a reaction between two lipids by clicking on the associated edge.
These reactions are visible by selecting the lipid molecular species option. Read more about the reactions in the section: Which lipids and reactions appeared on the graph?.
The reactions/pathways that are defined as active/the most active/inactive/the most inactive are visible on the graph with different colours (read
more about it in point 2 of Pathway options). The results are available in tables at the bottom of the page. See section: Reactions/pathways status and results tables
for more information.
Which lipids and reactions appeared on the graph?
We only refer to lipid type graphs (pathway option > type > lipid). There are two types of lipid reactions: the reactions that required a
compound and those that do not need it.
We can classify them in the following way:
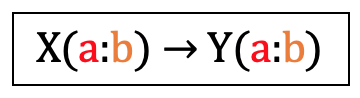
If the reaction does not require a compound, the reactant (X) and the product (Y) must have the same number of carbons (a) and bonds (b).
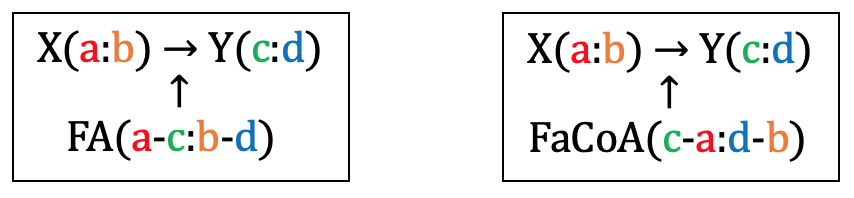
If the reaction requires a compound (fatty acid (FA) or fatty acyl CoA (FaCoA)), there must be a match between the carbons (a and c) and bond (b and d) numbers of the reactant / product / compound required.
So a lipid species is selected if it is involved as a product or a reactive in at least on reaction by respecting the previous rules.
Note
If your dataset doesn’t contain FA and FACoA molecular species, BioPAN will try to generate some as they are required for some reactions. The acyl chains of some lipid classes (LPA, LPC, LPE, LPI, LPS, LPG, CE, Cer, dhCer, SM and dhSM) will be used to create the reactions. This doesn’t impact the reactions scores as FA/FACoA quantitatie values are not used in the calculation score. In the case your dataset contains FA but no FACoA, the FA acyl chains will be used to generate FACoA molecular species. If the input does not have FA and FACoA nor the lipid classes previously listed, then reactions requiring these compounds won't occur.
Warning
For an X to Y reaction that requires a compound (FA/FACoA), a single product Y can be issued from a reactant X. But a reactant can give several products. This means that when you have sum composition annotation level in your dataset, the first possible combination that meets the rules will be retained. The order of the molecular species in the file will therefore have an impact on the final result.
The reactions that will appear depend on what has been selected in the pathway option menu (see the Pathway options section to understand the options available in this box):
If you select the
reactionsvalue for the subset of data menu and thelipid classoption for the level menu, a lipid appears on the graph if there is at least one species of this class of lipid that is involved in a reaction (reactant or product).
It is possible that a lipid class, whose species have been categorised as processed in the summary (see Data summary), does not appear in the graph. This means that the lipid class is known in the BioPAN database but there is no match at the species level.
If you select the
reactionsvalue for the subset of data menu and thelipid molecular speciesoption for the level menu, all the selected reactions will appear. A species appears on the graph if it is involved in at least one reaction (as reactant or product).
If you select the
pathwaysvalue for the subset of data menu, the principle is the same but you only select the reactions that come from a known pathway.
Warning
Because reactions involving Cardiolipins (CL) are complexe to define, BioPAN defines as selected all the reactants/products species involved in these reactions but is not able to know which reactant will produce which product.
The consequence is that the CL lipid class will appear on the lipid class graph but the species will never appear on the lipid molecular species one.
Note
For the fatty acid (pathway option > type > fatty acid), all the fatty acids that are processed (see Data summary) will appear on the graph.
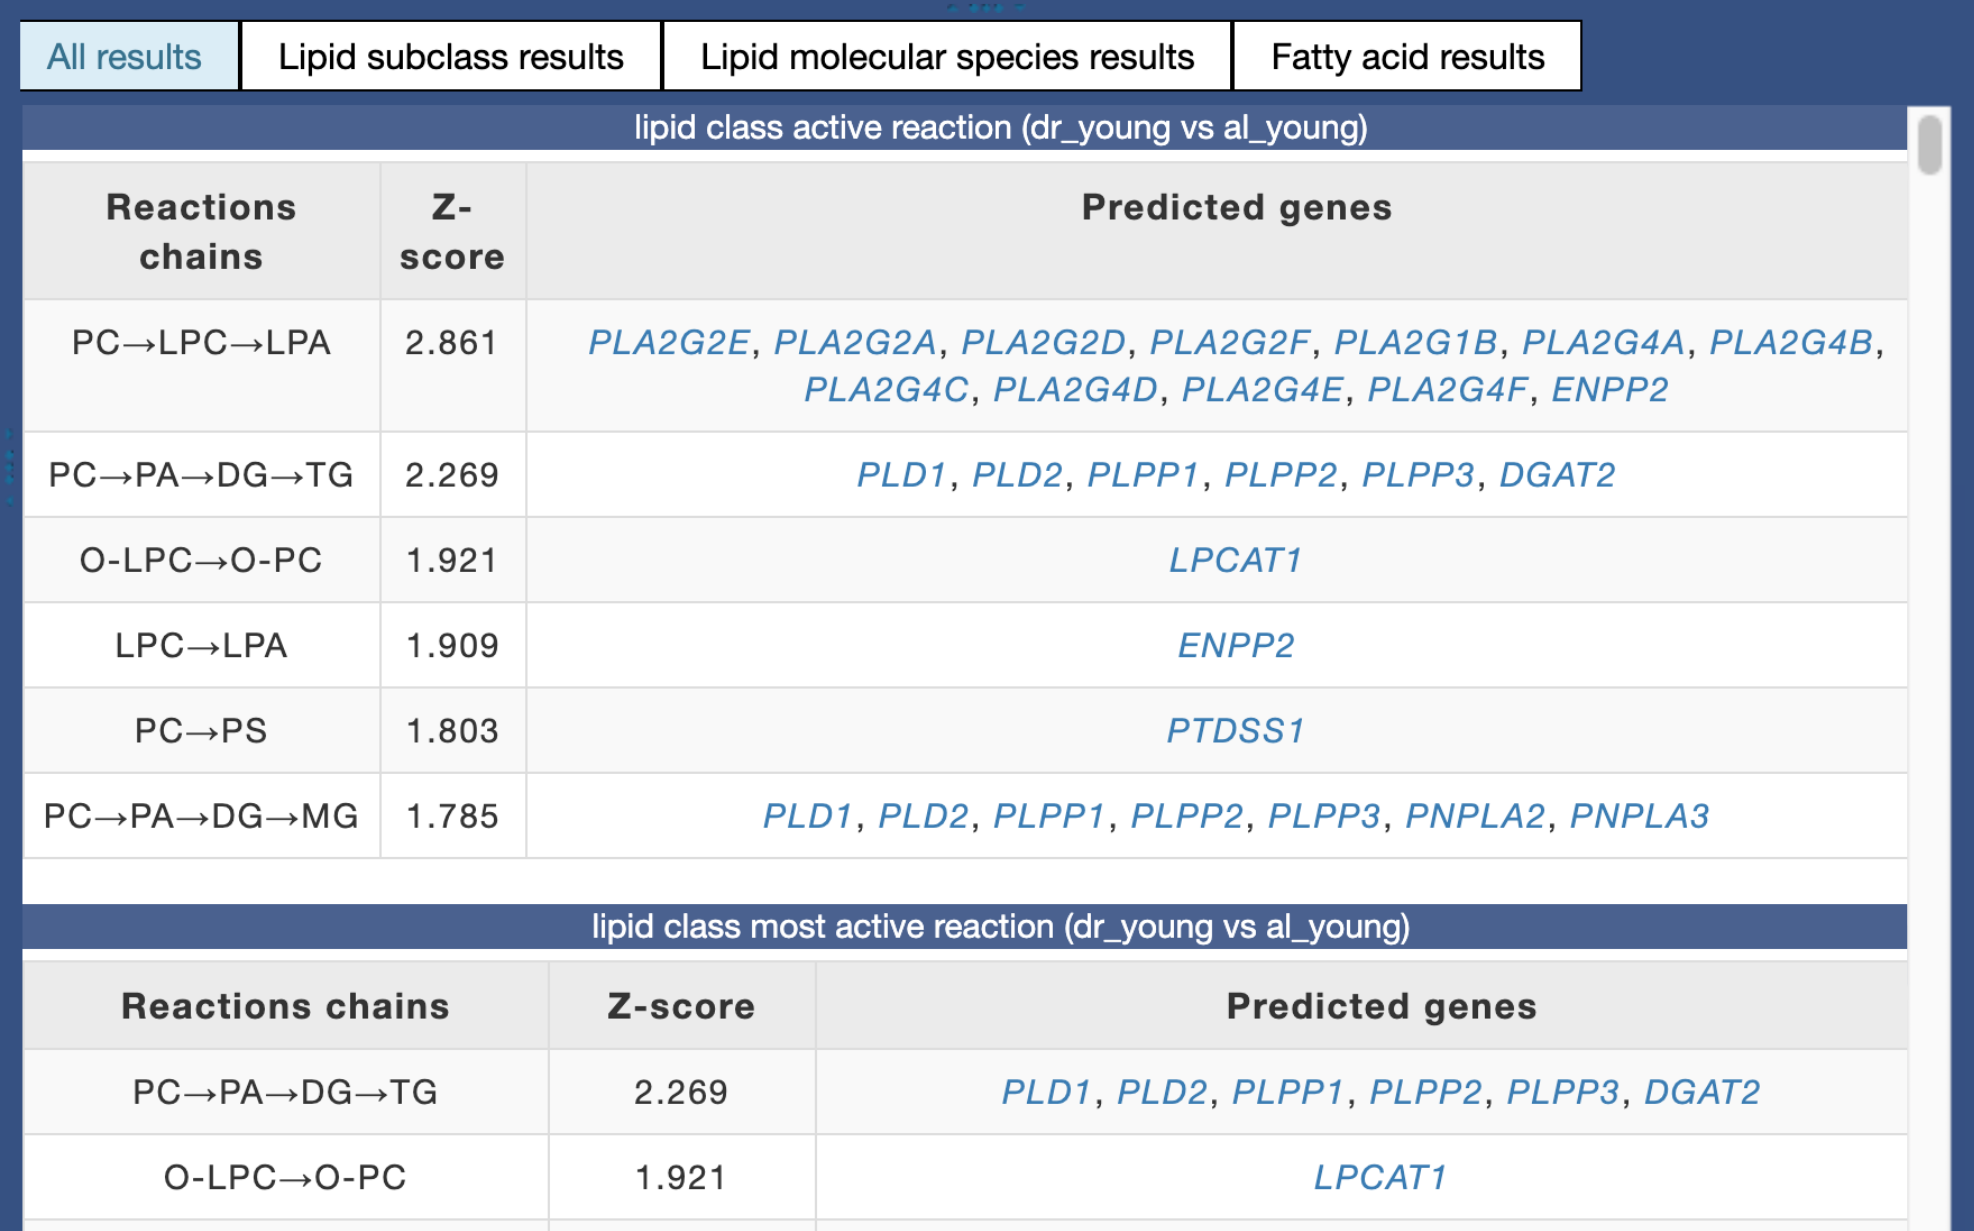
Reactions/pathways status and results tables
As explained in Explore the graph, the reactions/pathways with a particular status are visible on the graph and the results stored in tables at the bottom of the page.
There are 4 tables available by clicking on their names at the bottom of the page. The all results table list all the results
obtained for the options selected for subset of lipid data and in the pathway calculation box.
The others results will be different depending on the status, subset of lipid data and the options selected in the pathway calculation box:
Lipid subclass pathway:
type = lipidandlevel = lipid classLipid molecular species pathway:
type = lipidandlevel = lipid speciesFatty acid pathway:
type = fatty acid
You will be able to visualise the reactions/pathways that have a certain status for the chosen groups. There will be more or fewer reactions/pathways having status depending on the p-value defined (see point 2. of section Pathway options and section Pathway calculation).
The predicted enzymes for each pathway/reaction can also be visualised. The BioPAN database stores the enzymes that are predicted for each of the reactions themselves. When it is a pathway (= a sequence of reactions), the predicted enzymes are the union of the predicted enzymes for each reactions. More information on these enzymes are available by clicking on it.
For subset of lipid data = pathways, the column classfication(s) of the pathways indicates the name(s) given to the pathway in the literature.
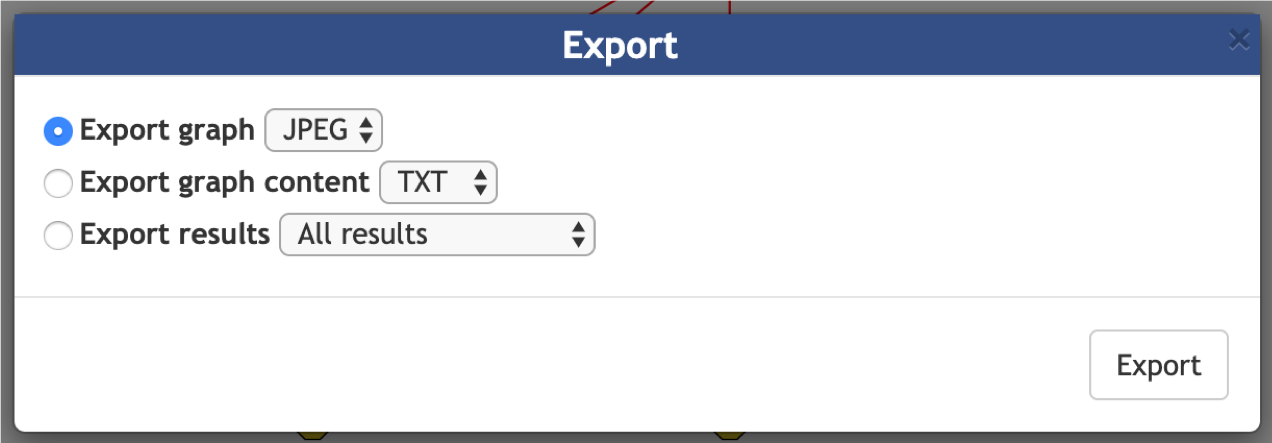
Exporting results
The graphs and results can be exported by clicking on the export button at the top right of the white window.
It is possible to export the drawn graphs (in JPEG, PNG and SVG) and the content (in JSON and TXT). The JSON format allows you to visualise textually the lipids (nodes) as well
as their positions, reactions (edges), scores and colours. The TXT file contains reactions and scores.
The 4 results tables can also be exported.
After closing the page
Your analysis stays available for 30 days! Save the URL by bookmarking the page and come back to continue your analysis later.