Build the pathways graph
Pathway options
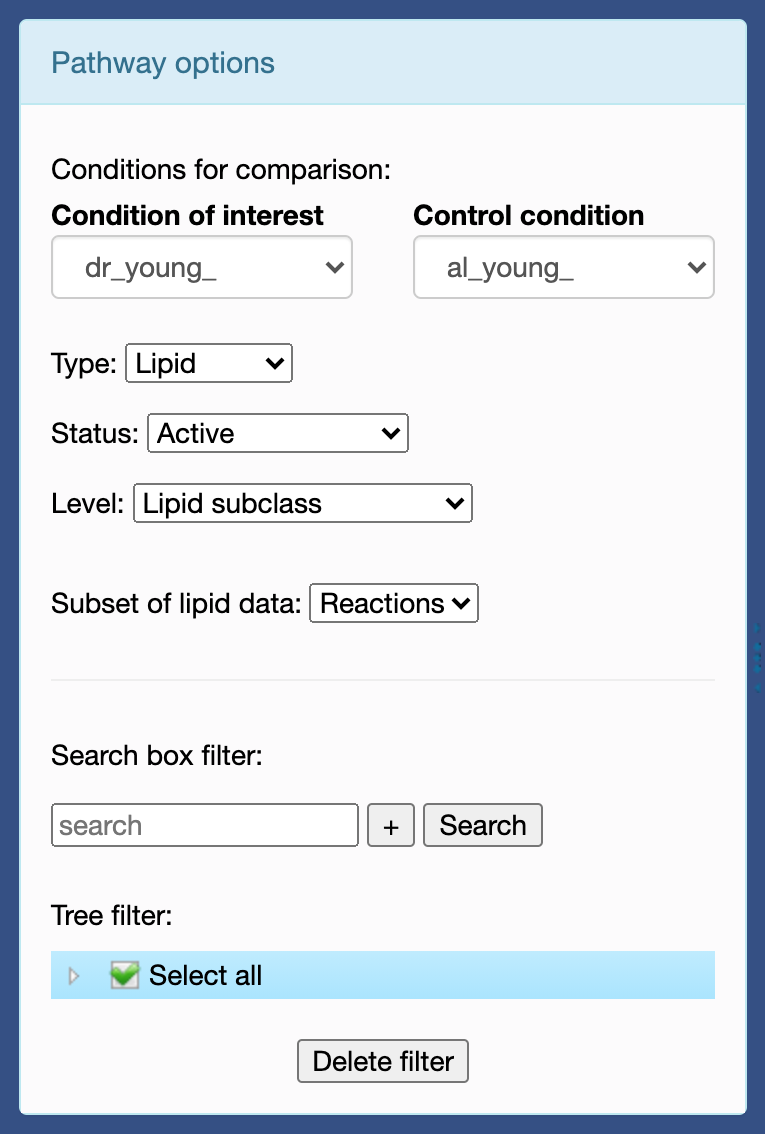
1. Groups for comparison: interest condition and control condition. Choose the groups of samples that you want to compare.
2. Type: lipid and fatty acid. Visualise the fatty acid or lipid pathways.
3. Status 1 : active, most active, suppressed and most suppressed.
View the pathways defined as having the selected status. The nodes of the lipids involved are stained blue with a red circle and the edges of the reactions are
gray.
To search for active pathways which have changed in the samples of interest compared to the control samples, BioPAN compute a Z-score for each weighted
pathway.
Those with higher scores will be classified as active. For example, let \(A = {A_1, A_2, ..., A_k}\) be the pathway of interest,
where \(A_i (i = 1, 2, ..., k)\) are metabolites.
The scoring scheme can be described in two steps. Firstly, we computed the weight vector \(w = [w, w_2, w_{k-1}]\), where each
weight \(w_i\) is computed as a ratio of product over reactant,
thus \(w_i = (A_{i+1}/A_i)(i = 1, 2, ..., k-1)\).
As a result, the weight for the reaction in A will indicate the shift toward more product or reactant in samples of interest than control samples.
This measurement can be used to predict whether a particular reaction is active or not. For each weighted edge of the pathway a t-test
between the samples of interest and the control samples is performed to generate a P-value (the alternative hypothesis is that the mean in samples of interest
is greater than control samples).
By assuming that the t-distribution can be approximated by a normal distribution, the P-value can be converted to Z-score by taking \(Z = CDF^{-1}(1-p)\),
where CDF is the cumulative distribution function. By doing this, we assign each edge \(i\) a Z-score \(Z_i(i = 1, 2, ..., k-1)\).
The score for pathway \(A\) is computed as follows:
This means \(Z_A\) also follows a normal distribution. In order to check if pathway A is active (significant) in samples of interest over control samples, we choose the significant level (P-value) to be 0.05. Hence, the corresponding Z-score is computed to be 1.645. Consequently, if \(Z_A > 1.645\) then \(A\) is classified as active, or non-active otherwise.
To search for suppressed pathways which have changed in the samples of interest compared to the control samples, the same steps are computed. The only difference is: the alternative hypothesis of the t-test is that the mean in samples of interest is less than control samples. So, if \(Z_A > 1.645\) then \(A\) is classified as suppressed, or non-suppressed otherwise.
The most active and the most suppressed are the most active/suppressed pathways in the active/suppressed identified pathways. That is, when there are several pathways that start with the same reactions, only one will be retained. For each step of the pathway, the Z-scores of the reactions are compared and the one with the highest Z-score will have its pathway considered as the most active/suppressed. Thus, it is not necessarily the pathway with the highest score that is retained because it may be that an intermediate reaction of another pathway is a higher Z-score. For example, the two following pathways are suppressed pathways:
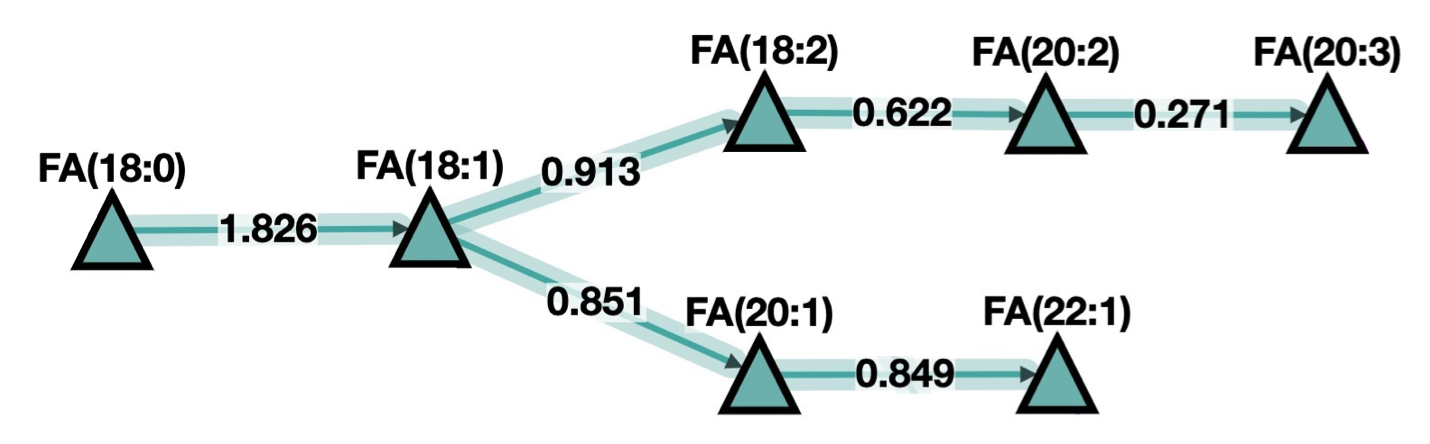
The FA(18:0) → FA(18:1) → FA(20:1) → FA(22:1) as Z-score equal to 2.0362 and the FA(18:0) → FA(18:1) → FA(18:2) → FA(20:2) → FA(20:3) as Z-score equal to 1.8164. It is the second pathway that is the most suppressed because 0.9133 > 0.8513.
4. Level (only available for lipids pathways): lipid subclass and lipid molecular species. Select the lipid subclass option to visualise the subclass of
lipids on the graph and the lipid molecular species one to visualise the molecular species. Find at the end of this part Data summary the difference
between a subclass and a molecular species.
5. Subset of lipid data (only available for lipid): reactions and pathways. Select the reactions option to view all the reactions that
are recognised by BioPAN. The pathways option allows to visualise the extracted reactions of pathway(s) that have been identified in
the literature and stored by BioPAN (examples: biosynthesis of PC, Kennedy pathway or triglycerol catabolism).
6. Filters (only available for lipids pathways): apply using the tree or search box field to view only metabolic pathways involving the selected lipids.
6.a. Search box filter: enter a value in the search box and click the search button to apply the filter. For example, look for a lipid subclass or an acyl chain (in the lipid molecular species graphs).
It is possible to combine two requests by clicking on the “+” button and choosing the operator to apply.
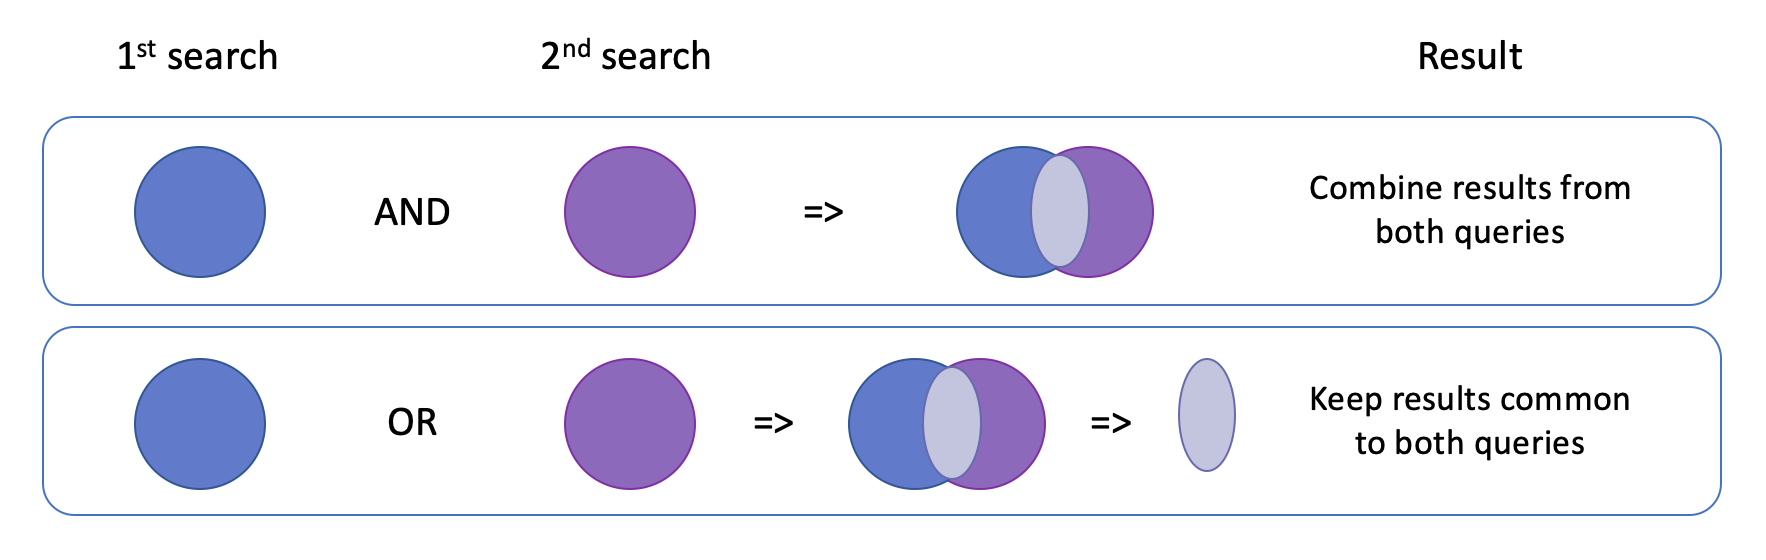
For example, on the lipid molecular species graph, searching: “PC” AND “38:3” displays all molecular species having in their name the two queries such as “PC(38:3)” and “O-PC(38:3)”. Searching “PC” OR “38:3” displays all lipid molecular species that have in their name one of the two queries such as “PC(32:0)” and “PA(38:3)”.
6.b. Tree filter: choose in the tree structure the lipids or the category(s) of lipids to display.
Pathway calculation
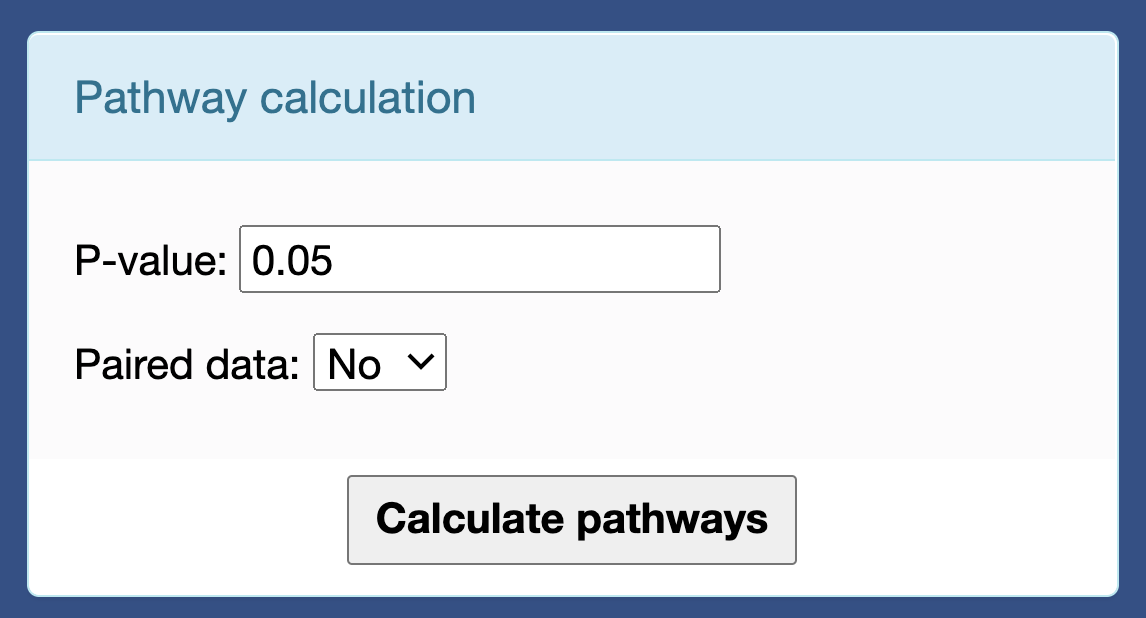
1. P-value: change the p-value of the t-test to search the active, most active, suppressed and most suppressed pathways.
By default, the P-value is 0.05 so the detection threshold for the pathways is equal to 1.645. To know the threshold of detection for the other p-value one must make the following computation: \(CDF^{-1}(1-Pvalue)\).
P-value |
Detection threshold |
0.1 |
1.282 |
0.05 |
1.645 |
0.02 |
2.054 |
0.01 |
2.326 |
2. Paired data: no and yes. By default, the no option is selected. Change to the yes if you have paired data.
Caution
When you want to change the value of the repeat measurement or p-value menus, you have to click on the calculate pathways button to take them into account.