: View detailed data for replicates: View time course graphs
Ctrl:
Untreated BMDM cells (control)
25-OHC:
Cells treated with 25-OH-cholesterol at time 0
*:
BMDM cells in lipid-depleted media containing compactin
25-OHC*:
cells in lipid-depleted media containing compactin and treated with 25-OHC at time 0
Details
Graph
Individual Expts
Ave Biol. Reps
LM_ID
Name
25-OHC* * 25-OHC Ctrl 0 hrs
25-OHC* * 25-OHC Ctrl 30 min
25-OHC* * 25-OHC Ctrl 1 hr
25-OHC* * 25-OHC Ctrl 2 hrs
25-OHC* * 25-OHC Ctrl 4 hrs
25-OHC* * 25-OHC Ctrl 8 hrs
25-OHC* * 25-OHC Ctrl 12 hrs
25-OHC* * 25-OHC Ctrl 24 hrs
Units . . . .
Legend: :Ctrl
:25-OHC
:Comp
:25-OHC + Comp
Legend: :Ctrl
:25-OHC
:Comp
:25-OHC + Comp
(BCD100322)
1,2-DG(38:5)
- 0.51 - 0.91
0.65 0.79 0.89 0.75
1.34 0.54 0.8 0.95
0.52 0.83 0.76 1.35
0.93 0.74 0.71 0.92
1.17 0.9 1 1.53
0.87 1.3 0.97 1.22
1.1 1.54 0.63 0.86
pmol/sample
Legend: :Ctrl
:25-OHC
:Comp
:25-OHC + Comp
Legend: :Ctrl
:25-OHC
:Comp
:25-OHC + Comp
(BCD100427)
1,2-DG(38:5)
- 1.3 - 1.01
1.28 1.36 - 1.72
0.81 1.19 0.88 1.31
0.71 1.09 0.77 1.75
1.15 2.86 1.05 1.57
1.41 1.71 1.26 0.91
1.49 0.64 0.96 2.17
2.02 1.02 1.1 0.68
pmol/sample
Legend: :Ctrl
:25-OHC
:Comp
:25-OHC + Comp
Legend: :Ctrl
:25-OHC
:Comp
:25-OHC + Comp
(BCD100624)
1,2-DG(38:5)
- 3.36 - 2.23
2.23 1.75 2.91 1.99
1.88 1.11 1.54 2.85
- 1.08 1.26 1.83
2.02 1.75 2.1 -
2.41 4.11 3 1.16
2.08 3.51 1.64 1.56
2.56 2.63 3.13 1.56
pmol/sample
We use Cookies
This site uses cookies and other tracking technologies to assist with navigation and your ability to provide feedback, analyze your use of our products and services, assist with our promotional and marketing efforts, and provide content from third parties.
 : View detailed data for replicates
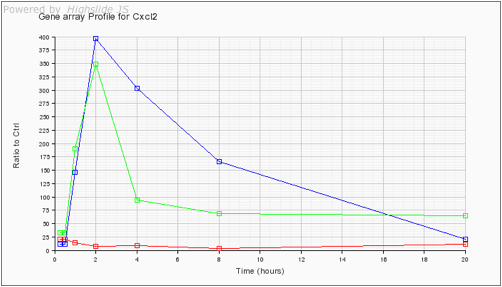 : View time course graphs